Where is your time going? How much time to spare do you have next week? Simply Goals & Tasks can figure that out for you!
Note: Go to the main menu (3 lines in the top-left corner), then tap “Measurement” to see these charts.
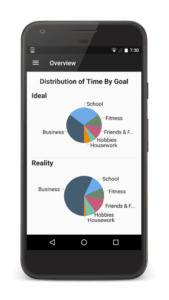
The first section is two pie charts called Distribution of Time By Goal. The top is the ideal distribution of your time based on what you said when you created your Goals. The second is how you are really distributing your time based on your Tasks.
I’m a hobbyist photographer and I used to always feel guilty for not spending more time on my pictures. Then we added these charts to Simply Goals & Tasks. I immediately saw that I was actually spending more time on my hobby than I wanted!
Note: You won’t have a ton of data yet since you only just started using the app.
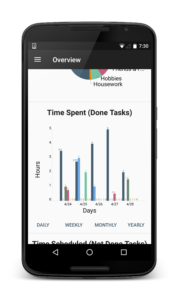
The next chart is a bar graph labeled Time Spent (Done Tasks). This chart if for looking backwards at how you actually spent your time. Each bar is the added total time spent on each Goal (color coordinated) for the time period. Play with the daily, weekly, monthly, yearly buttons on the bottom to zoom in and out on the data.
The complementary chart, Time Scheduled (Not Done Tasks) is next. This chart does just the opposite. It adds up the time for each task in the future that you still need to do. This chart is for looking to the future to see if your time is distributed the way you want.
Tip: Rotate your phone to landscape to see more days in the bar graphs.
Analytics right in the Planner
Graphs are pretty, but I actually get more value from the little total time numbers right in the Planner.
The Weekly, Monthly, and Yearly Planners (main menu -> Planner) add up your tasks right there. Since the Daily Planner is broken down by hour, it doesn’t make sense there.
When I’m making my plan to get all my tasks done, those little numbers give me immediate feedback on how well balanced my days/weeks are.
Over time, I’ve learned the I personally should only put about 6 hours of tasks into each day when planning my week. This leaves enough time for the last minute tasks that always pop up. When I see a day has much more than that, I can look for tasks that can be moved to another day, or plan on working late that day.
Tip: In the planner, there is a button on the top right to hide all done tasks. Toggle this button to “hide” and look at last week or last month. First, you’ll catch any forgotten tasks. But this is also a nice summary of how much you accomplished.

Too much for just your brain
There are 112 waking hours in a week. Do you know if you have more or less than 112 hours of tasks to do this week?
That’s just too many hours for any human brain to keep track of! This causes 2 problems:
1. It always feels like you have more time than you really do. And if you feel like you have lots of time (regardless if you actually do), you won’t be motivated to work hard.
Our advice for tackling this challenge is to avoid setting arbitrary deadlines. All your deadlines should be real and have reasons behind them. For example, “this doesn’t need to be done until tomorrow, but tomorrow I will not have the time. So, it actually does need to be done today.“
2. You don’t know whether you are overbooked or have time to spare. Right now, could you say “yes” to a new opportunity and know exactly how many late nights it would mean? Could you say “yes” to a spontaneous dinner out and still meet all your current commitments? Whether it’s professional opportunities or just being able to relax guilt free, these are important questions to be able to answer.
Our solution is to add up the time for you! And to put that info right in the Planner so you can make a plan that is ambitious but still feasible.